
The Annual Cost of Operational Friction in MEP Firms
A company can keep its crews busy while recurring operating losses consume a meaningful share of profit. The first step is to make the annual loss visible without counting it twice.
Watch the short introduction, then explore the assumptions and recovery model below.
A mechanical contractor sends a crew back to a job because prerequisite work was incomplete. An electrical firm uses premium overtime to recover a schedule broken by late material. A plumbing company finishes an installation but cannot invoice because completion evidence is missing. A maintenance provider loses supervisor hours reconciling work orders across disconnected systems.
Each event can look manageable. Across a year, the same operating conditions can repeatedly consume margin, working capital, and capacity. For small and midsize mechanical, electrical, plumbing, fire protection, HVAC, and related field service businesses, the useful question is not simply whether inefficiency exists. It is how much recurring loss is evidenced, what causes it, and which part can actually be removed.
What industry research tells us—and what it cannot
The 2018 Autodesk/FMI Construction Disconnected survey covered nearly 600 construction professionals. Respondents reported spending 35% of their time, more than 14 hours a week, on activities including finding information, resolving conflicts, and dealing with mistakes and rework. This is historical, survey-based construction research, not a current measurement of annual MEP profit loss. Multiplying 35% by a company’s revenue or payroll would overstate what the survey establishes. [1]
Research summarized by ASCE in January 2026 offers a different perspective. An exploratory study of one contractor’s projects found recorded precompletion field rework averaged 0.38% of contract value. The study estimated 0.76% after including postcompletion corrections, based on quality managers’ judgment that those costs were roughly equal; postcompletion cost data were unavailable. The findings concern field rework, not every form of operational inefficiency or a representative sample of small and midsize MEP firms. [2]
Definitions, samples, and methods differ. These sources establish that operating friction deserves investigation; they do not establish one defensible annual loss percentage for every firm. Build the company’s estimate from its own job costs and operating records.
Build an annual loss bridge
Separate three kinds of value: expenses that may be avoided, existing staff time that may be redeployed, and additional accepted output that may become possible. Keep customer changes, legitimate service visits, and planned overtime outside the avoidable-loss estimate unless evidence shows an operating failure caused the extra cost.
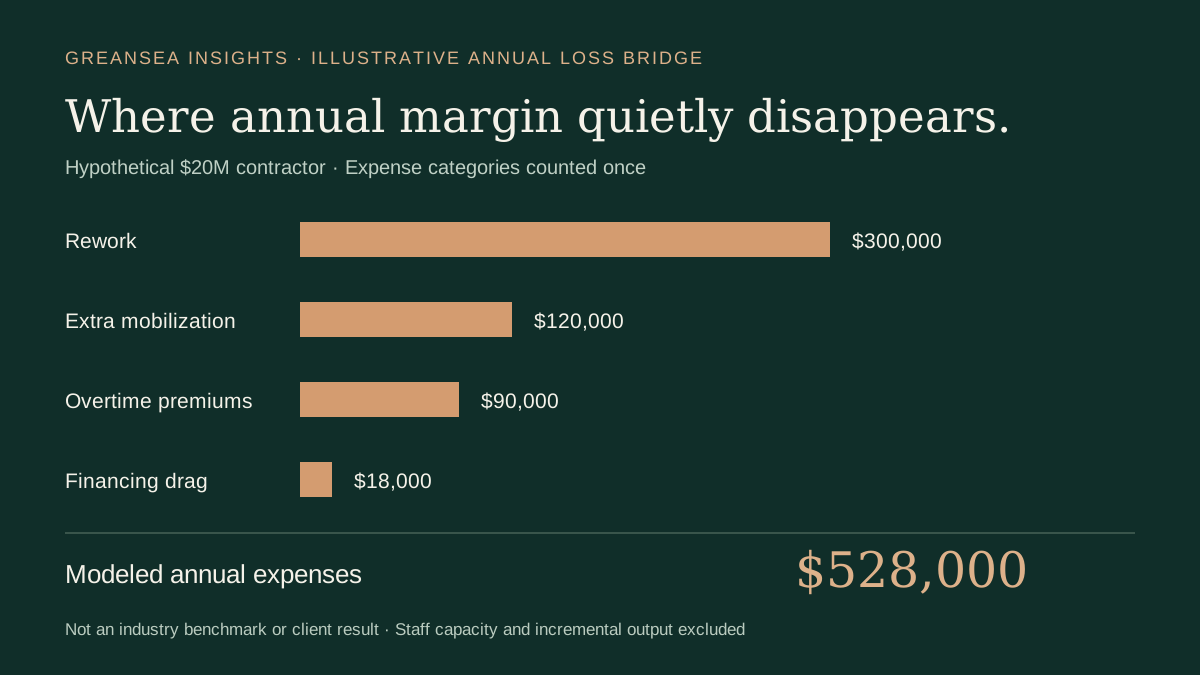
The following hypothetical firm has $20 million in annual revenue and $4 million in reported gross profit, a 20% gross margin. Its job-cost review identifies these assumed costs already incurred during the year. The amounts are chosen to demonstrate the method; they are not drawn from the research above.
| Loss category | Illustrative calculation | Annual cost |
|---|---|---|
| Rework | Corrective labor, replacement material, and write-offs documented by job; 1.5% of revenue assumed. | $300,000 |
| Extra mobilization | 400 avoidable trips × $300 in incremental travel, setup, and vehicle costs; corrective labor above excluded. | $120,000 |
| Overtime premiums | 6,000 avoidable premium hours × $15 premium only; hours in the first two categories excluded. | $90,000 |
| Financing drag | $150,000 average incremental borrowing from avoidable billing delays × 12% annual rate assumed. | $18,000 |
| Modeled expense total | $510,000 in job costs + $18,000 in financing expense. | $528,000 |
The modeled total equals 2.64% of revenue. The $510,000 job-cost component equals 12.75% of the firm’s reported $4 million gross profit. Financing expense is treated separately from gross profit. These costs are already reflected in the accounts; the bridge explains their composition rather than subtracting them from profit a second time.
Separately, assume coordinators spend 2,400 hours annually on duplicated entry and avoidable chasing. At a $45 loaded hourly cost, that represents $108,000 of staff capacity. Do not add it to the $528,000 expense total if payroll remains unchanged or those hours overlap with costs already counted. It becomes a financial gain only through a demonstrated use: avoiding an otherwise necessary hire, reducing paid overtime, or enabling more accepted work at the constraint.
A loss estimate identifies where to investigate. It becomes a recovery result only when the expense, accepted output, or cash movement actually changes.
Translate an improvement into a credible financial result
Suppose a sustained change removes 50% of the modeled job-cost leakage and financing drag. That would mean $255,000 less job cost and $9,000 less financing expense: $264,000 in annual pre-tax benefit before the costs of making and sustaining the change.
With revenue held at $20 million and no offsetting costs, gross profit would increase from $4 million to $4.255 million. Gross margin would rise from 20% to 21.275%, an increase of 1.275 percentage points. The financing benefit improves pre-tax profit, not gross margin. A 50% recovery is an assumption to test, not a promised result.
If the pilot, training, tools, and ongoing support cost $60,000 in the same illustrative year, the net pre-tax benefit would be $204,000. Separate one-time costs from recurring costs and use the actual timing of improvements. A run-rate opportunity achieved late in the year does not create a full year of realized savings.
Find the constraint behind the loss
Start with 15 to 20 recent comparable jobs, including profitable jobs, late jobs, and jobs with repeat visits. Trace the extra costs back to release readiness, scope revisions, material availability, quality acceptance, approvals, and billing evidence. Give each cost one primary category and preserve its source record. Reconcile a larger sample with job costs and the general ledger before annualizing it.
The biggest cost category may be a symptom. Repeated remobilization and recovery overtime can both originate in one unreliable release decision. Billing delays may originate in an incomplete acceptance handoff. Installing a readiness rule at the governing release point can be more valuable than separately attacking every downstream expense.
Use a focused pilot on one job family. Compare accepted jobs per week, first-time completion, return visits, avoidable premium hours, and completion-to-invoice time against similar work. Control for changes in scope, demand, pricing, staffing, and mix. If cost improves but completions fall, or the queue merely moves elsewhere, inspect the whole flow before claiming a gain.
CII’s rework reduction guidance connects tracking and cause analysis to corrective action and changes in the management system. GreanSea’s annual bridge extends that operating discipline across several loss categories while keeping the financial claims tied to evidence. [3]
From insight to action
What is operational friction costing your business each year?
At GreanSea, we help clients answer the three important constraint questions: what to change, what to change to, and how to cause the change. An Operational Constraint Diagnostic can connect recurring cost leakage to the condition governing throughput, then define a focused improvement to test.
See how a Diagnostic can maximize throughput ↗Sources and assumptions
- Autodesk/FMI: Construction Disconnected, 2018 survey; summary updated 2023.
- ASCE: How much does field rework in construction actually cost?, January 22, 2026. Research paper: Quantifying the Costs of Field Rework in Construction.
- CII: A Guide to Construction Rework Reduction, 2011.
All firm-level amounts, rates, recovery assumptions, and pilot examples are illustrative. No universal annual MEP loss estimate or GreanSea client outcome is claimed.